

SMS Marketing Statistics in 2026: Benchmarks, Revenue, and ROI Data for Ecommerce
Updated SMS marketing statistics for 2026 — revenue per message, conversion rates, and ROI benchmarks — plus text-to-buy performance data that challenges what most brands assume about the channel.
SMS marketing is booming. Message volume grew 40% year over year in 2025, outpacing every other marketing channel. But here's what the raw growth numbers don't tell you: most brands are still using SMS the same way they used it five years ago — blasting links and hoping for clicks.
The data tells a clearer story about what actually works. Below, we break down the latest SMS marketing statistics, compare them against email benchmarks, and show what happens when you stop treating SMS as a traffic channel and start treating it as a sales channel.
All industry-wide statistics referenced below come from a 2026 ecommerce marketing report¹ analyzing data from 150,000 brands and 321 million SMS messages sent in 2025. Text-to-buy statistics come from AudienceTap's internal platform data.
SMS Is the Fastest-Growing Marketing Channel
- 321 million SMS messages were sent by ecommerce brands in 2025
- SMS volume grew 40% year over year — up from 31% growth the year prior
- Ecommerce order volume itself grew 98% YoY, and SMS growth is keeping pace with that expansion
The channel is still small compared to email (27 billion emails sent in the same period), but it's growing faster and has structural engagement advantages that email can't match.
SMS Engagement Statistics
SMS consistently outperforms every other channel on raw engagement:
- 98% open rate for SMS messages (compared to 30.7% for email)
- 95% of texts are read within 3 minutes of delivery
- SMS click rates more than doubled year over year in 2025
- Average email read time is measured in hours; SMS is measured in minutes
These numbers explain why brands keep investing in the channel. The attention is there. The question is what you do with it.
SMS Revenue Per Message: The Benchmark That Matters Most
This is where most SMS marketing reports stop — and where the real story starts.
According to 2025 data across 150,000 brands¹, automated SMS messages generate 5x more revenue per send than broadcast campaigns. This mirrors a pattern across every channel — behavior-triggered messages dramatically outperform batch-and-blast.
But both of those numbers assume the customer has to leave the text thread, click a link, load a page, and complete a checkout. What happens when you remove that friction entirely?
| SMS Type | Revenue Per Send | Relative Performance |
|---|---|---|
| SMS campaigns (broadcasts) | $0.15 | Baseline |
| SMS automations (triggered) | $0.74 | 5x campaigns |
| Text-to-buy drops | $2.01 | 13x campaigns |
Text-to-buy — where customers purchase by replying to a text with no link, no cart, and no checkout page — generates $2.01 per message sent. That's 13x more than a standard SMS campaign and nearly 3x more than the best automated SMS.
The difference isn't better copy or better timing. It's removing the link entirely.
SMS Conversion Rate Statistics
Conversion rates tell a similar story:
- 0.97% — SMS click-to-conversion rate globally¹
- 5.5% — Average text-to-buy drop conversion rate (AudienceTap platform data)
A few notes on what these numbers mean:
The industry figure (0.97%) measures click-to-conversion — of people who click the link in an SMS, fewer than 1 in 100 complete a purchase. The total conversion rate (orders divided by messages sent) is even lower, since most recipients never click at all.
The text-to-buy figure (5.5%) measures total conversion — orders divided by messages sent. There's no click step. The customer replies to buy, and the order is placed inside the conversation.
When we measure total conversion — orders per message sent — across all three SMS types, the gap mirrors the revenue data:
| SMS Type | Total Conversion Rate | Relative Performance |
|---|---|---|
| SMS campaigns (broadcasts) | ~0.12% | Baseline |
| SMS automations (triggered) | ~0.5% | ~4x campaigns |
| Text-to-buy drops | 5.5% | 46x campaigns |
Campaigns send links that most recipients never click. Automations improve timing but keep the same checkout friction. Text-to-buy removes the checkout entirely — the reply is the purchase.
Individual text-to-buy programs regularly exceed those averages:
| Brand | Conversion Rate | Revenue/Message | ROI |
|---|---|---|---|
| Tinker Coffee Co. | 8.6% | $1.93 | 13.9x |
| Fellow Drops | 6.2% | $1.94 | 32x |
| Pull & Pour Coffee Club | 5.2% | $1.88 | 35.3x |
SMS vs Email: Side-by-Side Comparison
Using 2025 industry data¹, here's how the two channels stack up:
| Metric | SMS | |
|---|---|---|
| Messages sent (2025) | 27 billion | 321 million |
| Open rate | 30.7% | 98% |
| Click-to-conversion rate | 9.0% | 0.97% |
| Campaign revenue/send | $0.18 | $0.15 |
| Automated revenue/send | $2.87 | $0.74 |
| Read time | Hours | Minutes |
Email has higher click-to-conversion rates because the people who open and click an email are already highly engaged. SMS has dramatically higher reach and immediacy — 98% of messages are seen, and most are read within minutes.
The takeaway isn't that one channel is "better" than the other. It's that they serve different roles. Email excels at nurturing and complex messaging. SMS excels at urgency, immediacy, and action.
Where SMS falls short is the handoff. A text gets read, the customer is engaged, and then... they're sent to a link. They leave the conversation. They wait for a page to load. They navigate a checkout. That's where most of the 99% drop-off happens.
The Automation Gap: Why Triggered Messages Win
One of the clearest patterns in the industry data is the gap between campaigns and automations — and it holds across every channel:
| Channel | Campaign Revenue/Send | Automated Revenue/Send | Automation Advantage |
|---|---|---|---|
| $0.18 | $2.87 | 16x | |
| SMS | $0.15 | $0.74 | 5x |
For email, automations represent just 2% of total sends but generate 30% of total revenue. The top automation types — abandoned cart and welcome messages — account for 76% of all automation-generated orders.
This makes intuitive sense. A behavior-triggered message arrives when the customer is already thinking about you. A broadcast arrives when you decide to send it.
SMS automation follows the same pattern, just with a smaller multiplier (5x vs 16x for email). The gap is smaller because even automated SMS still relies on links to checkout pages — the urgency advantage of SMS narrows once the customer lands on the same checkout flow they'd reach from an email.
The Growth Is Concentrated
One more data point worth noting: Industry research found that the top 5% of brands drove 57% of total ecommerce order growth in 2025. The top 20% drove 81%.
Growth isn't distributed evenly. A small number of brands are pulling dramatically ahead, and the gap is widening. The common thread among the outliers isn't that they're sending more messages — it's that they're using their channels differently.
What Happens When You Remove the Link Entirely
The logical next step beyond automation is removing the friction point altogether. That's what text-to-buy does — the entire purchase happens inside the text conversation.
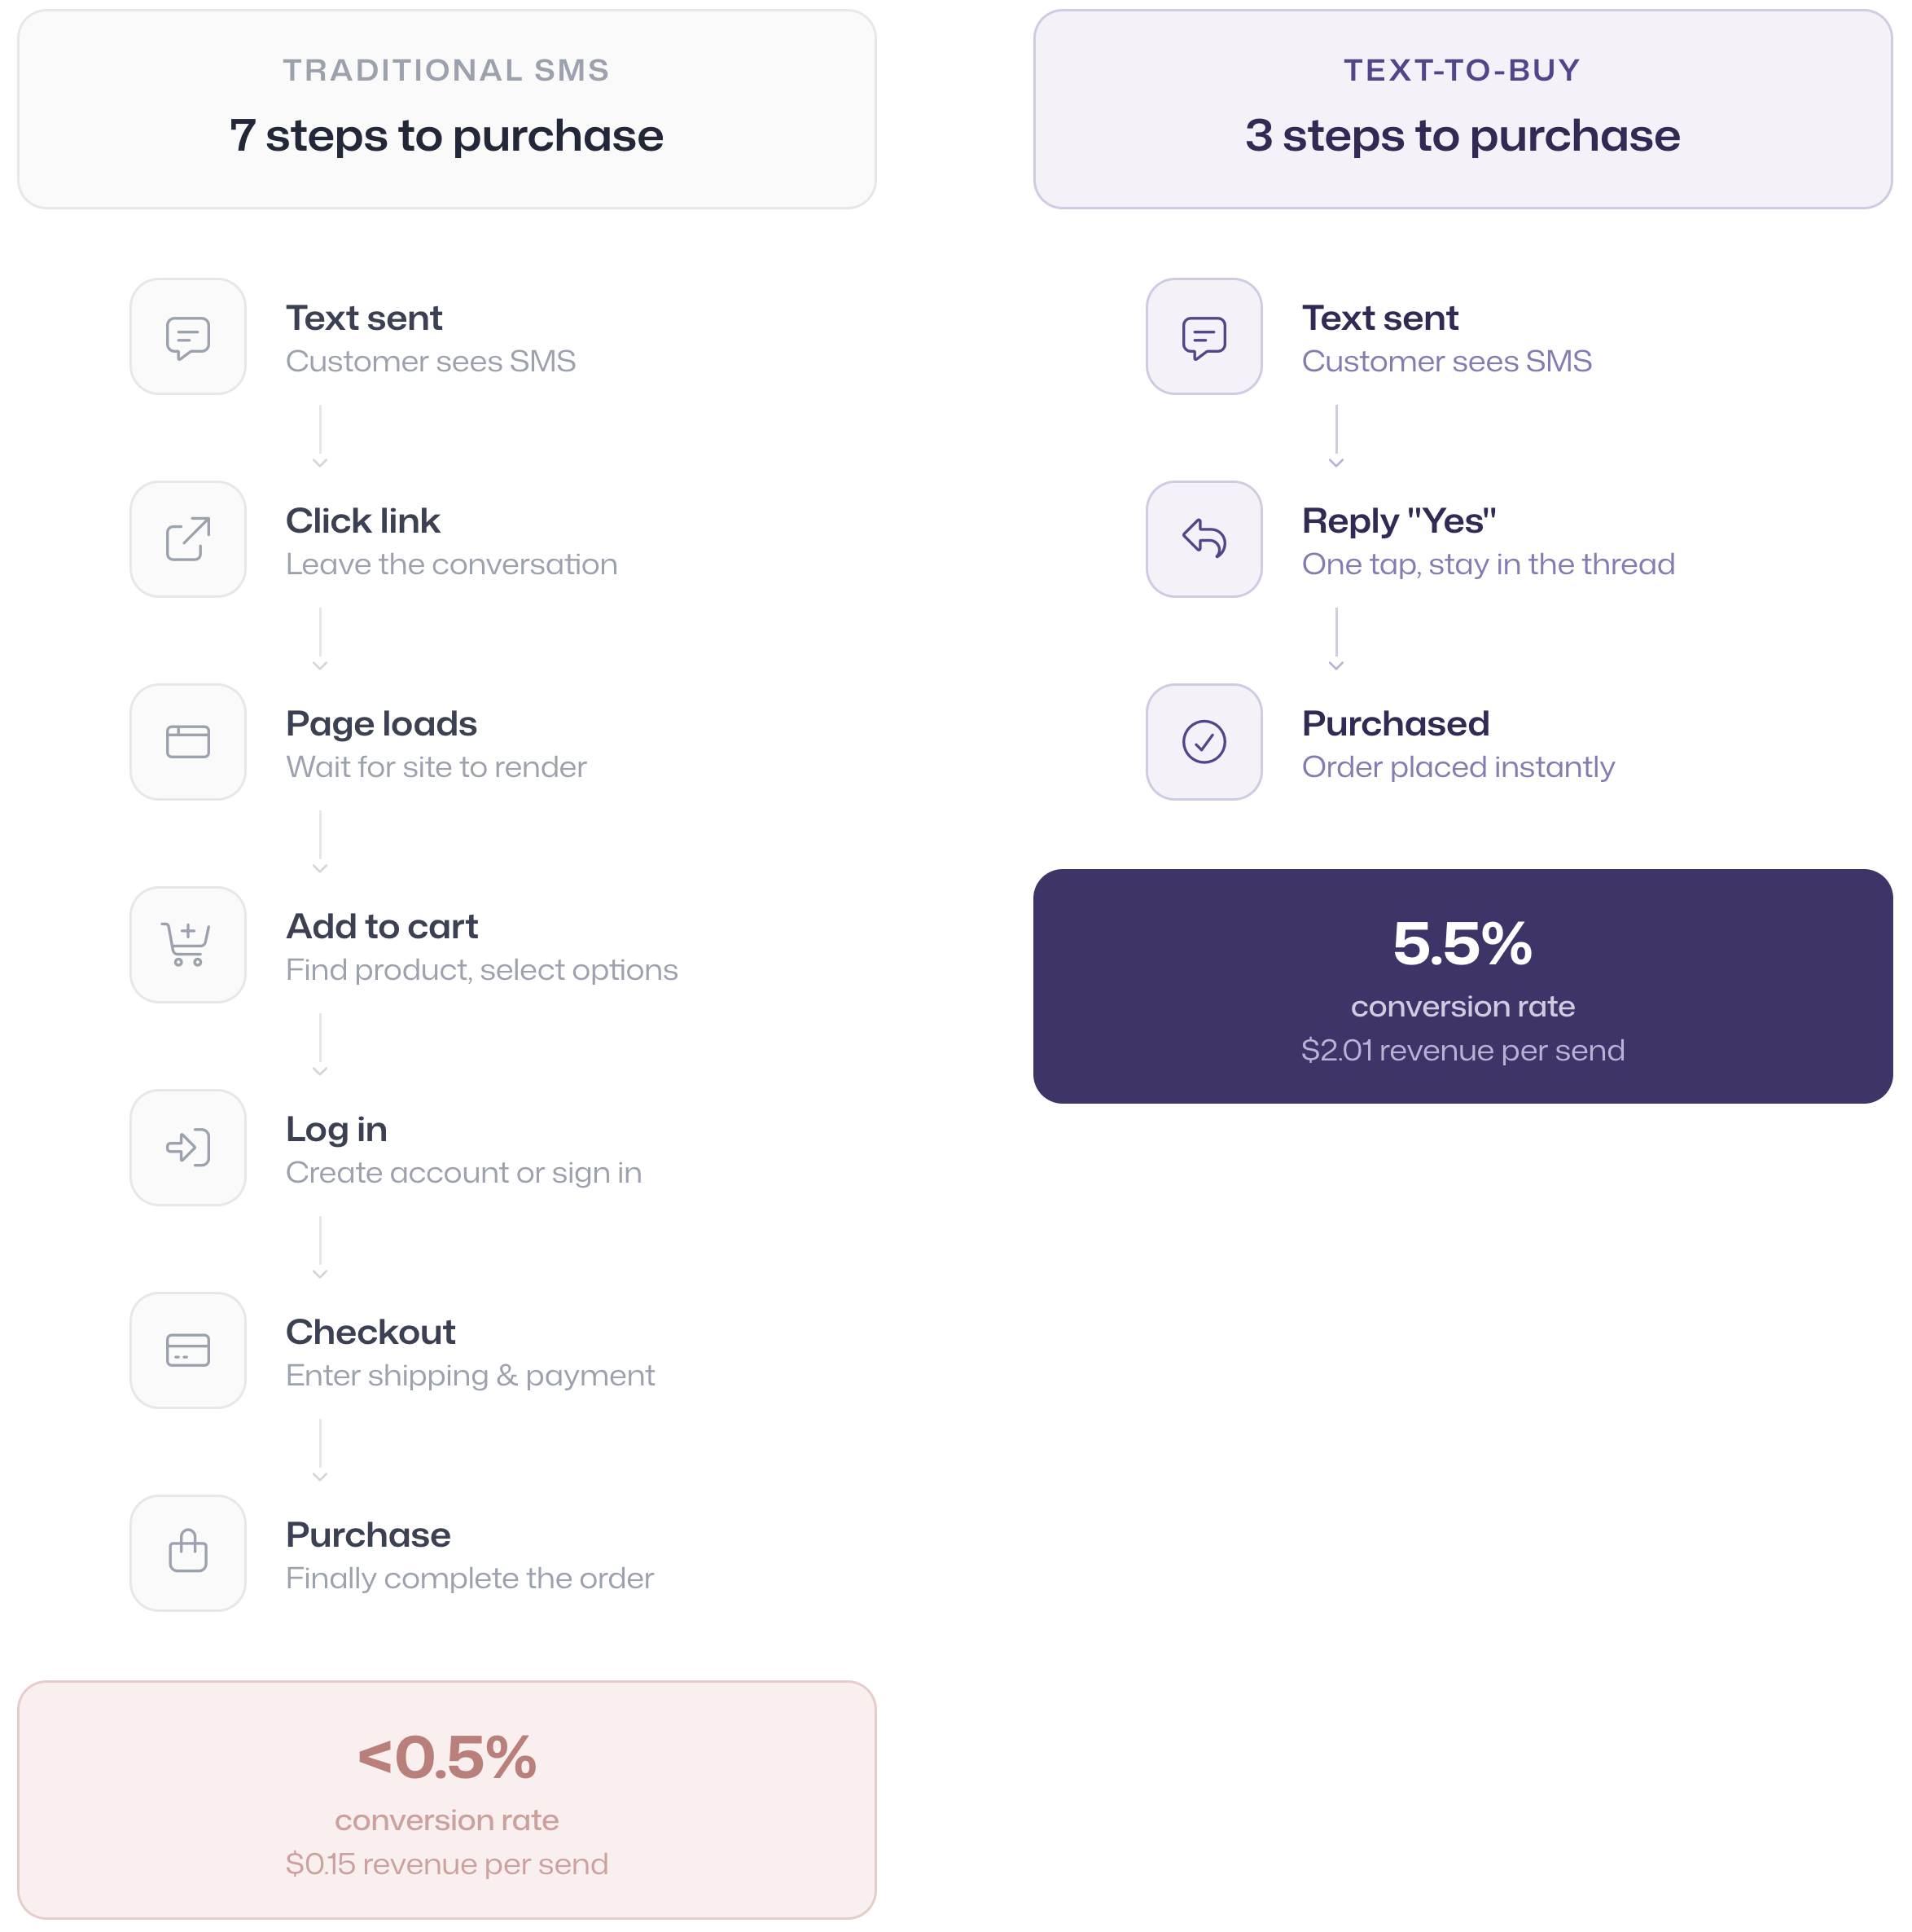
Instead of 7 steps to complete a purchase, it becomes 3 — and the customer never leaves the text thread.
Brands running text-to-buy programs see:
- $2.01 revenue per message vs $0.15 for SMS campaigns (13x)
- 5.5% conversion rate vs sub-1% for link-based SMS
- 3x higher overall spend from customers who buy via text
- ROI of 13x to 35x across published case studies
This isn't a marginal improvement to SMS marketing. It's a fundamentally different use of the channel — one where SMS isn't driving traffic somewhere else, but closing the sale itself.
What Happens After the Initial Purchase
Text-to-buy doesn't stop at the first reply. Two secondary campaign types — order bumps and rollover campaigns — extend the conversation and capture revenue that traditional SMS leaves on the table.
Order bumps are cross-sell offers sent immediately after a customer purchases through a text-to-buy drop. The customer buys Product A, and within the same text thread, gets offered a related Product B. No new session, no separate campaign — just a natural follow-up while buying intent is at its peak.
Rollover campaigns trigger when a text-to-buy drop sells out. Instead of a generic "sorry, sold out" message, customers who attempted to purchase receive an alternative product offer. The buying intent is already there — the customer just tried to buy. Rollover campaigns redirect that intent to a related product.
The performance of both campaign types reflects the difference between messaging someone already in buying mode versus someone you're trying to convince:
| Campaign Type | Revenue Per Message | Conversion Rate |
|---|---|---|
| Text-to-buy drops | $2.01 | 5.5% |
| Order bumps (post-purchase upsell) | $7.39 | 26.2% |
| Rollover campaigns (sold-out recovery) | $16.02 | 37.2% |
Order bumps generate $7.39 per message with a 26.2% conversion rate — nearly 4x the revenue per message of the initial text-to-buy drop. The customer already has their wallet out. The friction isn't just low — it's essentially zero.
Rollover campaigns are even more striking: $16.02 per message and a 37.2% conversion rate. These only go to customers who just tried to buy something and couldn't — the intent is as high as it gets. Offering a relevant alternative in that moment captures revenue that would otherwise vanish entirely.
For context, a standard SMS campaign generates $0.15 per message. A rollover campaign generates over 100x that.
What These Statistics Mean for Your SMS Strategy
The data points to a clear hierarchy of SMS performance:
- SMS campaigns (batch-and-blast) are the baseline — $0.15/send, sub-1% conversion
- SMS automations (behavior-triggered) are 5x better — $0.74/send
- Text-to-buy drops (no link, no cart) are 13x better than campaigns — $2.01/send, 5.5% conversion
- Order bumps (post-purchase cross-sell) jump to $7.39/send, 26.2% conversion
- Rollover campaigns (sold-out recovery) reach $16.02/send, 37.2% conversion
If you're running SMS campaigns today, the first move is automating your highest-value flows: welcome messages, reorder prompts, and abandoned cart recovery. That's where the industry data shows the biggest lift for traditional SMS.
The second move is asking whether your customers even need to leave the text thread at all. For product drops, reorders, and anything where the customer already knows what they want, removing the checkout entirely closes the gap between SMS attention (98% open rate) and SMS revenue (currently $0.15/send for most brands).
The third move is maximizing every drop. Order bumps turn a single purchase into a cross-sell opportunity at 26.2% conversion. Rollover campaigns turn sold-out frustration into $16.02 per message. These aren't separate programs — they're layers on top of text-to-buy that capture revenue most brands never knew they were leaving behind.
The brands in that top 5% aren't sending more texts. They're making each text do more.
¹ Source: Omnisend 2026 Ecommerce Marketing Report — analysis of 150,000 brands, 27 billion emails, and 321 million SMS messages sent in 2025.
AudienceTap is a text-to-buy platform that lets customers purchase products by replying to a text message — no links, no carts, no checkout pages.
With reply-to-buy purchasing, AI-timed replenishment drops, abandoned cart recovery, and list growth tools, AudienceTap turns SMS from a traffic channel into a sales channel. Brands on the platform average $2.01 in revenue per message and 5.5% conversion rates on drops.
Talk to a text-to-buy expert to see how it can transform your SMS marketing program.